年度毎の訪問診療実績
訪問診療数
Bar chart. Data table with 13 rows and 2 columns follows.
| 訪問診療数 | |
|---|---|
| 2014年 | 218 |
| 2015年 | 429 |
| 2016年 | 523 |
| 2017年 | 871 |
| 2018年 | 1,036 |
| 2019年 | 894 |
| 2020年 | 1,054 |
| 2021年 | 1,048 |
| 2022年 | 901 |
| 2023年 | 763 |
| 2024年 | 776 |
| 2025年 | 793 |
看取り数
Bar chart. Data table with 13 rows and 2 columns follows.
| 看取り数 | |
|---|---|
| 2014年 | 3 |
| 2015年 | 31 |
| 2016年 | 58 |
| 2017年 | 66 |
| 2018年 | 138 |
| 2019年 | 164 |
| 2020年 | 129 |
| 2021年 | 191 |
| 2022年 | 176 |
| 2023年 | 86 |
| 2024年 | 119 |
| 2025年 | 94 |
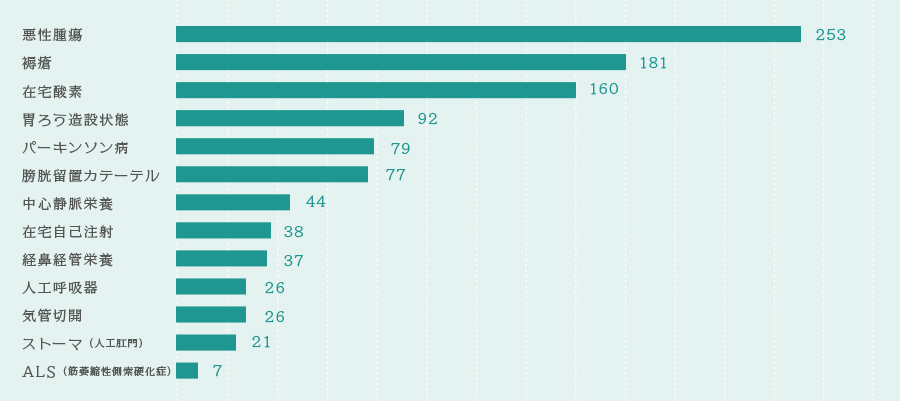
主な疾患、医療処置の件数 ※2019年9月現在